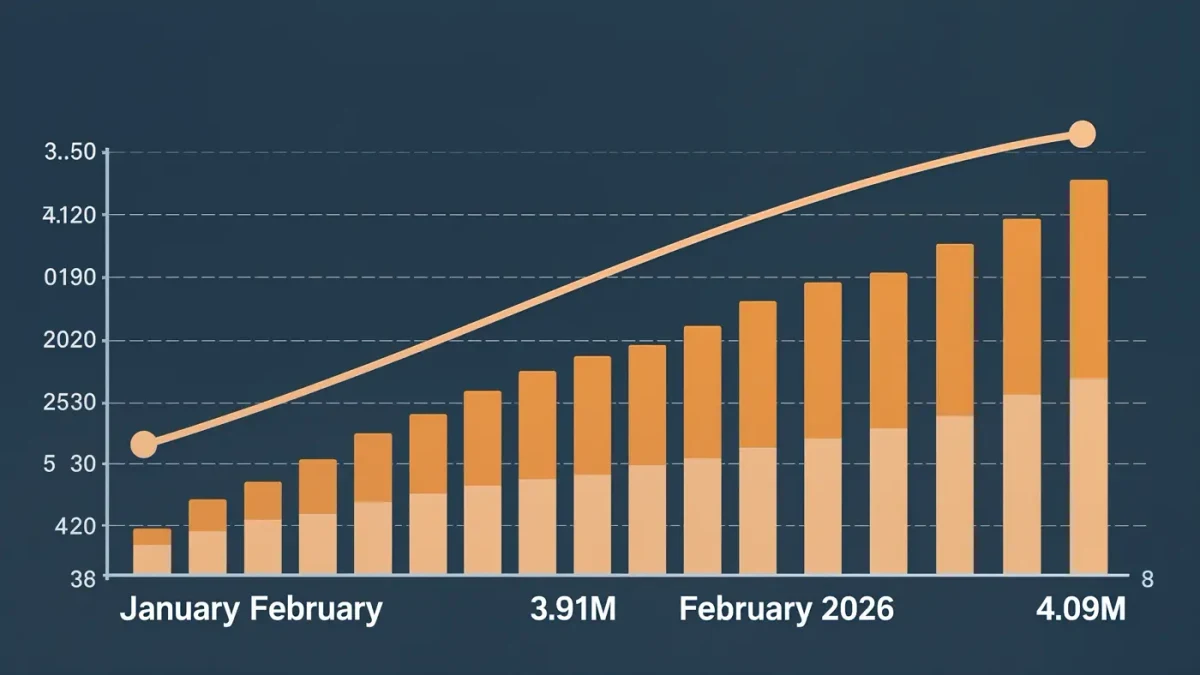
Existing-home sales unexpectedly rose 1.7 percent in February 2026 to a seasonally adjusted annual rate of 4.09 million, with the national median price at $398,000, up 0.3 percent from a year earlier, the National Association of Realtors reported on March 10, 2026, as Reuters and other outlets covered. Inventory rose to 3.8 months of supply at the current sales pace — still lean by historical standards, but part of a steady climb that has defined the market's slow rebalancing. The gain followed January's 8.4 percent plunge to a 3.91 million pace, the weakest month since late 2023, and economists largely read the pair as one weak month and one normalization rather than a new trend.
For buyers and sellers, the details below matter more than the headline.
What the numbers said
Three figures frame the month. Sales: 4.09 million SAAR, up 1.7 percent from January but still below the year-earlier pace — the market's step-forward after a step back. Prices: a $398,000 median, essentially flat year over year for another consecutive month, extending the flat-price stretch that began in 2025. Supply: 3.8 months — up from the sub-three-month depths of the lock-in crunch, moving toward balanced territory (around five to six months) without reaching it. Separate monthly data from Realtor.com through the same stretch showed active listings up 7.9 percent year over year, with a national median list price around $403,000, confirming the inventory build from the listing side.
What analysts said it means
The consensus reading: January's drop exaggerated softness — holiday-period contract signings plus rate hesitation — and February recovered the mechanical part of it. NAR's own forecast stance through the period had projected sales rising in 2026 after three flat years, and the inventory climb is the supply half of that thesis arriving on schedule. The lock-in effect continues to restrain how many owners list, but each month of churn and every rate dip loosens it at the margin. What no one claimed: a boom. A 4-million-ish annual pace remains historically slow; the story is normalization, not acceleration.
What it means if you're buying
March-through-May is the market's volume season, and entering it with rising listings changes negotiation math in the buyer's favor at the margins: more choices, longer days-on-market on overpriced listings, and sellers more receptive to inspection findings and credits than they were in the bidding-war years. The flat national median hides the split — competitive tension persists in affordable metros and in move-in-ready homes, while dated or oversized listings sit and cut. The practical plays: watch days-on-market by neighborhood rather than national headlines, and treat rate dips as windows when competing buyers re-emerge.
What it means if you're selling
Price to the current market, not last year's neighborhood peak — the flat-to-soft median means the overshoot sits unsold, and the data through spring 2026 kept showing price cuts on stale listings. Condition and presentation do the compensating work: the sales that closed quickly in this market were prepared, photographed, and priced right on day one. And if the lock-in math is what keeps you holding, note that every month of rising inventory slightly erodes the seller's edge you are saving for — the trade-off between your rate and your timing is now measured in months of supply, published monthly.